
- Nisshin OilliO HOME
- Investor Relations
- Financial Results
Consolidated Financial Results
Net sales
Million yen
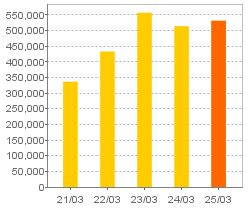
| 2021/03 | 2022/03 | 2023/03 | 2024/03 | 2025/03 |
|---|---|---|---|---|
| 336,306 | 432,778 | 556,565 | 513,541 | 530,878 |
Operating profit
Million yen
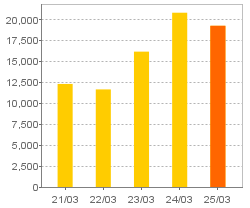
| 2021/03 | 2022/03 | 2023/03 | 2024/03 | 2025/03 |
|---|---|---|---|---|
| 12,324 | 11,670 | 16,186 | 20,840 | 19,278 |
Ordinary profit
Million yen
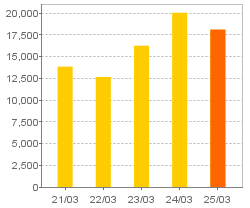
| 2021/03 | 2022/03 | 2023/03 | 2024/03 | 2025/03 |
|---|---|---|---|---|
| 13,836 | 12,648 | 16,242 | 20,033 | 18,089 |
Profit attributable to owners of parent
Million yen
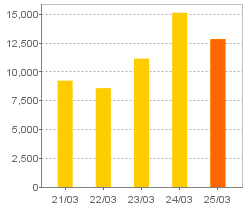
| 2021/03 | 2022/03 | 2023/03 | 2024/03 | 2025/03 |
|---|---|---|---|---|
| 9,244 | 8,595 | 11,157 | 15,148 | 12,850 |
Basic earnings per share
yen
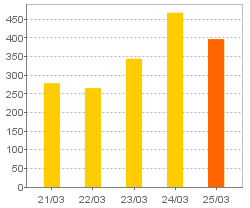
| 2021/03 | 2022/03 | 2023/03 | 2024/03 | 2025/03 |
|---|---|---|---|---|
| 278.34 | 265.24 | 344.25 | 467.37 | 396.41 |
The Company conducted a reverse stock split on October 1, 2017, at a ratio of one share for every five shares of common stock. Dividends before the reverse stock split have been adjusted to reflect the reverse stock split.
Dividends
yen
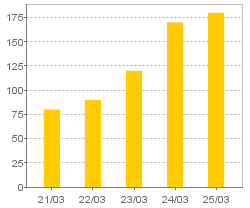
| 2021/03 | 2022/03 | 2023/03 | 2024/03 | 2025/03 | |
|---|---|---|---|---|---|
| 2Q | 40.00 | 45.00 | 45.00 | 60.00 | 90.00 |
| 4Q | 40.00 | 45.00 | 75.00 | 110.00 | 90.00 |
| Total | 80.00 | 90.00 | 120.00 | 170.00 | 180.00 |
Financial Position
Total assets
Million yen
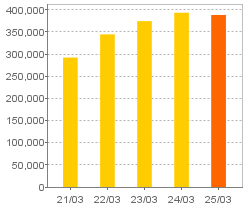
| 2021/03 | 2022/03 | 2023/03 | 2024/03 | 2025/03 |
|---|---|---|---|---|
| 292,154 | 344,506 | 374,453 | 393,382 | 388,242 |
Net assets
Million yen
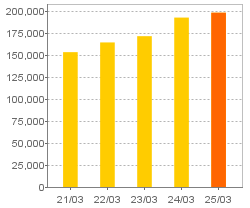
| 2021/03 | 2022/03 | 2023/03 | 2024/03 | 2025/03 |
|---|---|---|---|---|
| 153,259 | 164,314 | 171,418 | 192,562 | 198,086 |
Net assets per share
yen
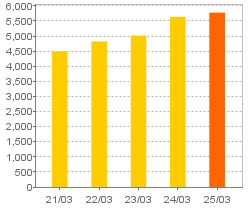
| 2021/03 | 2022/03 | 2023/03 | 2024/03 | 2025/03 |
|---|---|---|---|---|
| 4,491.81 | 4,820.49 | 5,015.63 | 5,634.36 | 5,772.47 |
The Company conducted a reverse stock split on October 1, 2017, at a ratio of one share for every five shares of common stock. Dividends before the reverse stock split have been adjusted to reflect the reverse stock split.
Capital adequacy ratio
(%)
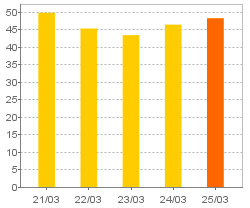
| 2021/03 | 2022/03 | 2023/03 | 2024/03 | 2025/03 |
|---|---|---|---|---|
| 49.8 | 45.3 | 43.4 | 46.4 | 48.2 |
Segment information and Business Performance
Segment information
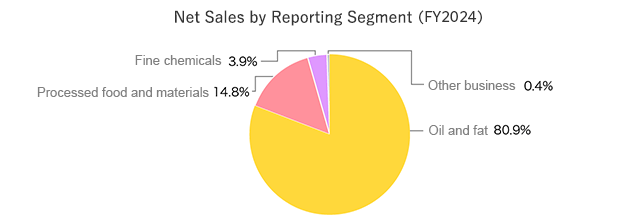
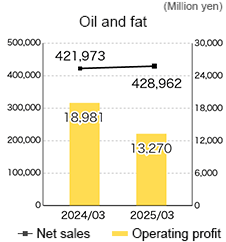
Million yen
| 2024/03 | 2025/03 | ||
|---|---|---|---|
| Oil and fat | Net sales | 421,973 | 428,962 |
| Operating profit | 18,981 | 13,270 | |
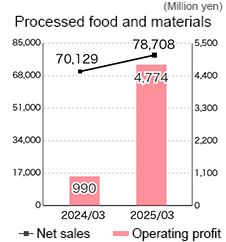
| Processed food and materials | Net sales | 70,129 | 78,708 |
| Operating profit | 990 | 4,774 | |
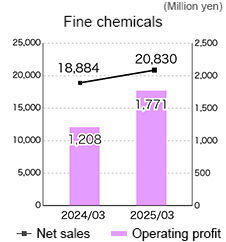
| Fine chemicals | Net sales | 18,884 | 20,830 |
| Operating profit | 1,208 | 1,771 | |
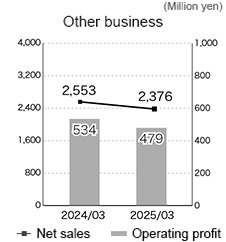
| Other business | Net sales | 2,553 | 2,376 |
| Operating profit | 534 | 479 | |
Regional Information
Million yen
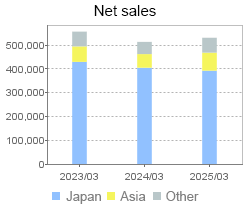
Million yen
| 2023/03 | 2024/03 | 2025/03 | |
|---|---|---|---|
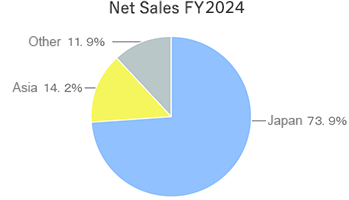
| Japan | 429,416 | 404,831 | 392,491 |
| Asia | 65,014 | 57,202 | 75,645 |
| Other | 62,134 | 51,508 | 62,741 |
Business Performance
Million yen
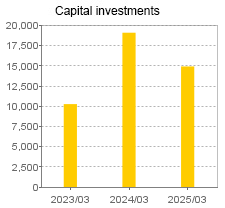
| 2023/03 | 2024/03 | 2025/03 |
|---|---|---|
| 10,270 | 19,113 | 14,934 |
Million yen
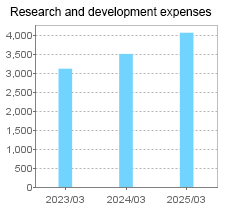
| 2023/03 | 2024/03 | 2025/03 |
|---|---|---|
| 3,128 | 3,519 | 4,079 |
Million yen
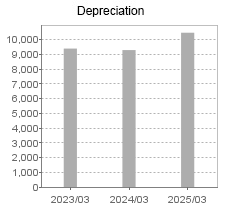
| 2023/03 | 2024/03 | 2025/03 |
|---|---|---|
| 9,388 | 9,287 | 10,463 |