Environmental Targets for 2030

Response to TCFD recommendations

The Nisshin OilliO Group is dedicated to achieving sustainability—the sustainable growth of the Group and the sustainable advancement of society—by working with society to create shared value through solutions to societal issues. Because our business operations are based on plant resources, and because climate change has a significant impact on plant growth, responding to climate change is an important management theme. With that in mind, we endorsed the TCFD recommendations in March 2021, and since fiscal 2022, we have disclosed information through analysis of climate change-related risks and opportunities, financial impact simulations, and other aspects. In light of the recent development-oriented transfer of climate-related disclosure regulation duties from the TCFD to the ISSB, we will continue to enhance our disclosures related to climate change response and closely monitor upcoming trends in the introduction of IFRS S1 and S2 in Japan.

(1) Governance

  • Important management issues are deliberated and decided by the Board of Directors. Basic policies, strategies, and measures regarding climate change and other sustainability issues are approved by the Board of Directors after deliberation by the Business Strategy Council, a deliberation body for the execution of business.
  • In fiscal 2024, the Management Sustainability Committee* deliberated on updating the strategic roadmap to promote decarbonization at its second meeting. The committee also continued to deliberate on the reassessment of priorities and revising CSV goals, including natural capital.
    (*As part of the fiscal 2025 revision of our committee and meeting structure, the Management Sustainability Committee was dissolved.)
  • The Board of Directors is responsible for resolving climate change issues and supervising progress toward goals. The Board of Directors also collaborates with the Business Strategy Council to proactively resolve issues, obtaining sufficient insight from outside experts when necessary.
  • Incentives provided for contributions to resolving climate change issues are reflected in the payment standards for compensation for Officers (excluding Outside Directors) based on the extent to which ESG targets are achieved.
  • To address climate change, we have established Environmental Targets for 2030 as well as specialized departments (the Corporate Sustainability Strategy and the Environmental Solutions).
  • In terms of separating supervision and execution, the Board of Directors is responsible for supervising climate-related issues, while departments, offices, Group companies, and other entities are responsible for implementing solutions for climate-related issues.

▼ Figure 1: Sustainability promotion structure (from the corporate governance structure chart)

  • 1. The Business Strategy Council is chaired by the president and consists of senior managing officers and managing officers.
  • 2. Standing Audit & Supervisory Board members attend meetings of the Risk Management Committee, the Internal Control Committee, and the Business Strategy Council as observers.
  • 3. Aside from the above, a meeting body has been organized to ensure the effectiveness of auditing through regular information exchange and sharing between standing Audit & Supervisory Board members and corporate staff divisions.

(2) Strategies

In fiscal 2021, the Group launched The Nisshin OilliO Group Vision 2030—our vision to be realized by 2030—and Value Up+, our medium-term management plan for the first four years of efforts toward achieving Vision 2030. Under Vision 2030, we will further utilize oils and fats based on plant resources—the core of the Group’s strengths—to drive growth and create diverse value in the form of good flavor, health, and beauty. To that end, we will strive to conserve and restore the global environment that underpins our business, and take steps to make the sustainability of raw materials as far-reaching as any other company. We are also looking to establish a long-term strategy to achieve carbon neutrality by 2050.

  • To further improve the resilience of these strategies, we are continually considering ways to identify, assess, and respond to climate-related risks and opportunities.
  • Our approach to these considerations is to start by identifying climate-related risks and opportunities, and then qualitatively evaluate their impact and other aspects before proceeding to more detailed analysis, taking into account the relative importance, availability of analytical data, and other factors.
  • In this series of processes, we consider how things will unfold by comparing two scenarios: a world where climate change is limited (a world where the global mean temperature increase since the Industrial Revolution is limited to around 1.5°C to 2°C [the 1.5°C/2°C scenario]) and a world where climate change continues to progress (a world where the global mean temperature increase since the Industrial Revolution is around 4°C or higher [the 4°C scenario]). In general, under the 1.5°C/2°C scenario, carbon taxes and other laws and regulations are strengthened and consumer preferences change notably, while under the 4°C scenario, climate change becomes more severe, and windstorms, floods, and other natural disasters increase in intensity and frequency.

(2-1) Identifying and assessing climate-related risks and opportunities

  • First, we identified short-, medium-, and long-term climate-related risks and opportunities for the Group and qualitatively assessed the financial implications thereof (Table 1).
  • Potential risks with significant impact on our business operations include increased costs due to carbon taxes, expenses from purchasing CO2 allowances, increased capital investment costs associated with decarbonization, increased raw material procurement costs due to more prevalent sustainability-conscious buying behavior and more frequent and severe natural disasters, decreased sales due to declining consumer spending caused by dwindling product value, and decreased product supply capacity and sales when production plants are damaged.
  • Potential opportunities with significant impact on our business operations include reducing production costs through improved efficiency in energy, water, and other resources, and increasing sales by developing and selling products that accommodate changes in consumer and customer buying behavior.

▼ Table 1: List of climate-related risks and opportunities

Definition of terms

  • Timing: Indicates the shortest timeframe in which the risk/opportunity could occur. The timing is a qualitative judgment based on short-term meaning less than five years, medium-term meaning five to no more than 10 years, and long-term meaning 10 or more years. Notably, risks and opportunities that have already emerged are marked as short-term. This definition of timing is consistent with the timeframe of the Group’s management strategies (Value Up+ for short-term strategy through 2024, and The Nisshin OilliO Group Vision 2030 for medium-term strategy through 2030).
  • Likelihood: Indicates the likelihood or probability that the risk/opportunity will actually occur, rated qualitatively on one of three levels (high/medium/low). Notably, risks and opportunities that have already emerged are marked as high.
  • Impact: The extent to which the risk/opportunity, once realized, would affect the Company, primarily in terms of financial impact, rated qualitatively on one of three levels (large/medium/small).
  • : Indicates a trial quantification of impact (in monetary terms).
Classifications Financial impact Impact Likelihood
Timing
Short-term Medium-term Long-term
Risks Transition Policy and legal Higher carbon taxes could increase the cost of energy, containers, transportation, and the like. Additionally, introducing a corporate CO2 emissions trading scheme could trigger expenses from purchasing allowances. (★) Large High
Stricter traceability-related laws and regulations could result in greater demand for certified raw materials, causing raw material prices to increase, trigger capital investment expenses, increase administrative costs, and result in fines or negatively impact sales due to violations. Medium High
Changes in the social environment caused by climate change and the impact of stricter laws and regulations could give rise to legal action in response to violations, deforestation, and human rights issues in the supply chain. Medium Low
A shift away from conventional, environmentally taxing farming methods and an increase in land use regulation strictness could result in lower production volumes and higher labor costs, leading to higher raw material prices. (★) Large High
Technology The development and diffusion of decarbonization technologies could require businesses to introduce large-scale facilities to decarbonize production systems, increasing capital investment expenses. Additionally, investments might not be as effective as expected, and new breakthrough technologies might not be introduced due to lack of funds. Large High
Market The price of environmentally conscious raw materials—namely soybean, rapeseed, and palm—could increase due to more prevalent sustainability-conscious buying behavior. Additionally, if sustainability cannot be guaranteed, sales could decrease due to declining consumer spending caused by dwindling product value. Large High
Reputation As ESG investments accelerate, the Group’s stock price or financing could stagnate if the Group’s ESG efforts are delayed or its disclosures are inadequate. Additionally, the unintended spread of rumors could reduce corporate value. Medium Low
Physical Acute Areas where raw materials are produced could suffer due to increasingly frequent and severe natural disasters, reducing yields and causing raw material prices to soar. Additionally, if production plants are damaged, sales could decrease due to the temporary reduction in the production, sales, and logistics capacity. (★) Also, the unintended spread of rumors could reduce corporate value. Large High
Chronic Changes in weather patterns (e.g., rising temperatures, changes in precipitation) could negatively impact the growth of soybean and palm, reducing production volumes and increasing raw material prices. These changes could also negatively impact the quality and safety of raw materials and the stability of the supply of products. Additionally, the unintended spread of rumors could reduce corporate value. Large Medium
Opportunities Resource efficiency Improved resource efficiency (e.g., introducing more efficient equipment in terms of energy and water consumption, advanced production management) could reduce production costs. Large High
Promoting resource recycling by promoting plastic recycling and switching to containers made of bioplastics and plastic alternatives could help stabilize procurement for containers and packaging materials and add value to products, thereby improving customer assessment. Medium High
Energy source Selling products with lower CO2 emissions (Scope 1 and 2) and promoting added value through the use of renewable energy could lead to greater satisfaction and increased sales to customers looking to reduce supply chain emissions. Medium High
Markets of products/services Sales could increase through the development and sale of products (e.g., plant-derived cosmetics, functional foods, certified palm oil) that accommodate changes in consumer and customer buying behavior (e.g., ethical consumption, health- and nature-oriented behavior). Large High
Resilience
Widespread adoption of drought- and heat-tolerant agricultural products could stem reductions in raw material production volumes and supply instability due to climate-related damage (e.g., heat waves, droughts). Medium Medium
Strengthening the BCP—even if natural disasters become more frequent and severe due to climate change—could allow the Company to maintain its system for supplying products during emergencies, helping stabilize and increase sales, improving its social value, increasing its stock price, and facilitating fundraising. Medium High
  • Of the risks identified above, we have analyzed three in detail this year: (1) Changes in raw material yields and prices, (2) Cost increases due to carbon taxes, ETS, and the like, and (3) Decrease in profits due to shutdowns caused by climate-related disasters. For specific considerations, we referred to qualitative and quantitative information (e.g., grain price forecasts) under the scenarios published by the IPCC, IEA, FAO, NGFS, and other international organizations.
  • Abbreviations
  • IPCC: Intergovernmental Panel on Climate Change, an intergovernmental organization that aims to provide a scientific basis for national governments’ climate change policies.
  • IEA: International Energy Agency, an international organization established in the wake of the 1973 oil crisis to cover energy security and all other aspects of energy policy.
  • FAO: Food and Agriculture Organization of the United Nations, a UN agency that promotes food security and nutrition, agriculture (including crops, livestock, fisheries, and aquaculture), and rural development.
  • NGFS: Network for Greening the Financial System, an international network of central banks and financial supervisory agencies for considering financial supervisory responses to climate change risks.

(ⅰ) Changes in raw material yields and prices

First and foremost, the following table shows the projected changes in yields for each major raw material. Essentially, yields appear to trend upward for each raw material.

Soybean Rapeseed Palm Cacao
Total global yield under the business-as-usual (BAU) scenario through 2050,
indexed to the most recent results (2012 = 100)
143 150 158 126

Next, to understand the differences in impact under the 2°C and 4°C scenarios, we created Figure 2 using changes in yield per unit through 2050 under the 2°C and 4°C scenarios, indexed to the BAU scenario through 2050 (set to 100) from FAO. The legend in the upper right part of the figure shows the classifications.

▼ Figure 2: Risk of changes in raw material yields

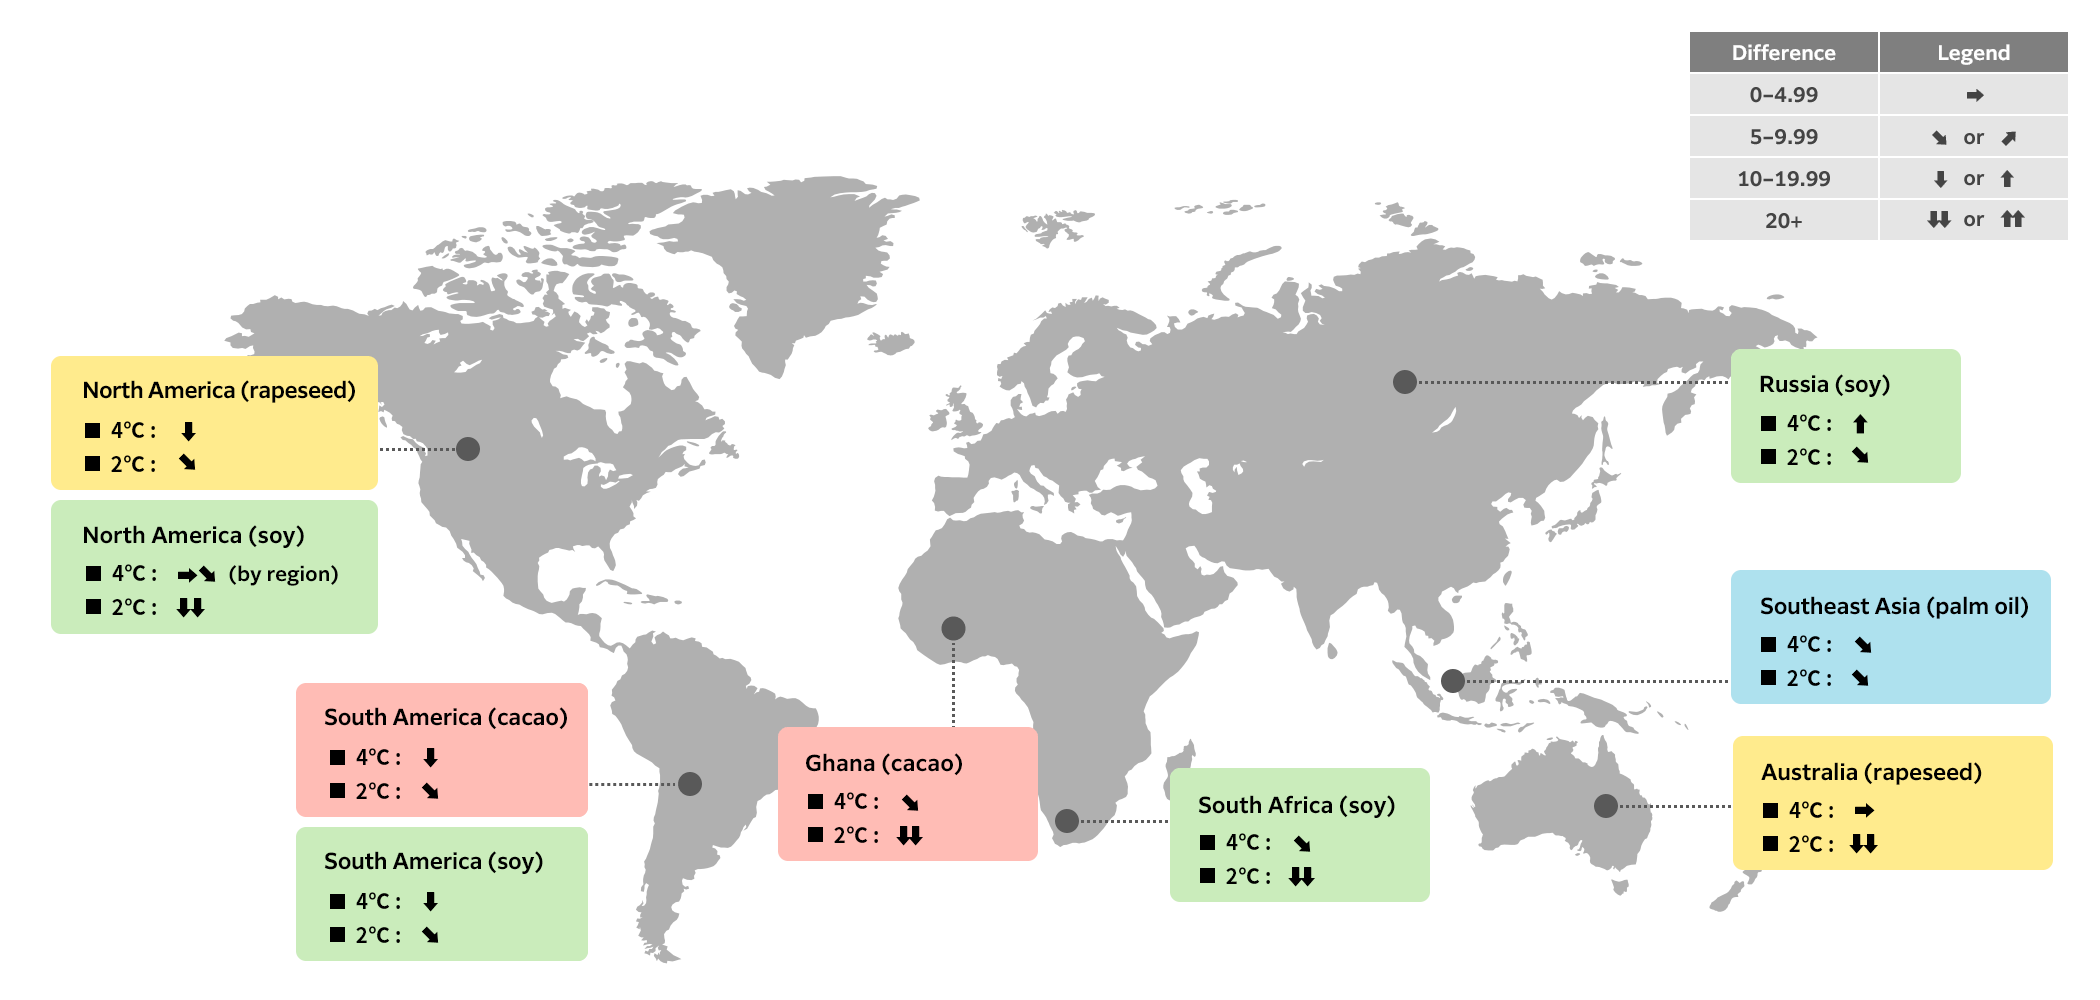
  • * Analysis based on FAO yield scenario values.
  • * Locations on the map in North America, South America, and Southeast Asia do not refer to specific countries.

The analysis shows that yields will essentially increase worldwide through 2050; however, comparing the 2°C and 4°C scenarios to the BAU scenario, the analysis shows that soybean and rapeseed yields will hold steady or increase in some areas under the 4°C scenario, but the yields for all raw materials will decrease in all areas under the 2°C scenario. This is presumably due to policy factors (e.g., land use regulations and restrictions on environmentally taxing farming methods) having a greater impact than worsening climate conditions in some regions and countries, despite the combined impact of the various factors included in the scenarios. Notably, in the future, we will consider demand trends as well as supply trends, and delve deeper into our analysis from both perspectives.

Regarding changes in the price of raw materials, the annual increase in procurement costs due to changes in soybean prices between 2030 and 2050 was calculated for the United States and Brazil—major producers of soybean, one of the main raw materials—using the NGFS 1.5°C scenario. Changes in prices under this scenario reflect the cost of carbon pricing and production efficiency improvements, and the calculations show the financial impact of transition risk.

▼ Table 2: Financial calculations of raw soybean price increases due to decarbonization in agriculture

Scenario Country 2030 procurement cost increase
(billion yen/year)
2050 procurement cost increase
(billion yen/year)
1.5°C USA 13.1 21.0
Brazil 3.4 4.9

Financial impact of changes in prices based on mean annual purchase amount in 2020–2022

As for prices, the price of soybean from both the United States and Brazil will increase under the 1.5°C scenario, representing the largest impact among risk items for which financial impacts were calculated (totaling ¥16.5 billion/year in 2030 and ¥25.9 billion/year in 2050). We plan to examine the impact of changes in the prices of rapeseed, palm oil, and other raw materials in the future.

(ⅱ) Cost increases due to carbon taxes, ETS, and the like

We used carbon pricing from the Announced Pledges Scenario (2.0°C) and the Net Zero Emissions by 2050 Scenario (1.5°C) in the IEA’s World Energy Outlook 2022 to calculate the annual financial burden posed by carbon pricing in 2030 and 2050 for both The Nisshin OilliO Group, Ltd. (Japan) and ISF (Malaysia), the largest greenhouse gas emitters in the Group. These two companies account for more than 96% of the Scope 1 and 2 emissions managed by the Group.

▼ Table 3: Financial calculations of cost increases due to carbon taxes, ETS, and the like

Scenario In-house measures Company name 2030 financial burden
(billion yen/year)
2050 financial burden
(billion yen/year)
2.0°C Status quo The Nisshin OilliO Group, Ltd. 2.7 4.0
ISF 0.84 3.3
Achieving reduction targets The Nisshin OilliO Group, Ltd. 1.6 0
ISF 0.4 0
1.5°C Status quo The Nisshin OilliO Group, Ltd. 2.8 5.0
ISF 1.9 4.2
Achieving reduction targets The Nisshin OilliO Group, Ltd. 1.7 0
ISF 0.91 0

Status quo: Calculated based on FY2022 CO2 emissions
Achieving reduction targets: Calculated with a 50% reduction in emissions in 2030 (compared with 2016), zero emissions in 2050
Carbon pricing: See WEO 2022, IEA

2030 2050
2.0°C 1.5°C 2.0°C 1.5°C
The Nisshin OilliO Group, Ltd. $135 $140 $200 $250
ISF $40 $90 $160 $200

The above analysis of the risk of cost increases due to carbon taxes, ETS, and the like suggests that the financial burden in 2030 can be roughly halved by achieving the reduction targets under both the 2.0°C and 1.5°C scenarios. If the reduction targets are achieved, the total financial burden for the two companies in fiscal 2030 would be ¥2.0 billion/year under the 2.0°C scenario and ¥2.61 billion/year under the 1.5°C scenario.

(ⅲ) Decrease in profits due to shutdowns caused by climate-related disasters

For this analysis, we envisioned shutdowns of our domestic operations due to flooding. Additionally, since physical risks are long-term, the analysis only covers 2050. We calculated the annual decrease in operating profit due to shutdowns under the IPCC’s 4°C and 2°C scenarios.

▼ Table 4: Financial calculations of decrease in profits due to shutdowns caused by climate-related disasters

Scenario Country Annual decrease in operating profit
due to shutdowns in 2050 (million yen/year)
4.0°C Japan 176
2.0°C Japan 132
  • Annual decrease in operating profit = Frequency of disasters x Number of shutdown days x Annual operating profit ÷ 245 days
  • The frequency of disasters is based on the number of occurrences of daily precipitation of 200 mm or more on the east side of East Japan (0.4 times/year under 4.0°C scenario; 0.3 times/year under 2.0°C scenario) according to “Climate Change in Japan 2020, Detailed Version” by the Ministry of Education, Culture, Sports, Science and Technology and the Japan Meteorological Agency.
  • The number of shutdown days is based on the corresponding figure (10 days) for below floor-level inundation according to the “Manual for Economic Evaluation of Flood Control Investment” by the Ministry of Land, Infrastructure, Transport and Tourism.

The above analysis of the risk of a decrease in profits due to shutdowns caused by climate-related disasters suggests that even under the 4.0°C scenario—considered to have a large impact from climate-related disasters—the impact is only 176 million yen/year, the smallest among the risk items for which financial impacts were calculated. For future analysis, we plan to consider expanding the number of countries and the impact of property damage (e.g., repair costs) resulting from disasters.

(2-2) Measures to address climate-related risks and opportunities

  • Given the risks and opportunities we have identified, we believe the impact will be substantial regardless of whether we move toward a world where climate change is limited or a world where climate change continues to progress, making it necessary to further enhance the resilience of the Group’s strategy for the medium and long term.
  • Accordingly, we will take the following measures to address risks and opportunities that substantially impact the Group’s business operations, from upstream to downstream in the supply chain. We believe these measures will help improve the resilience of the Group’s strategies.

▼ Table 5: Measures to address climate-related risks and opportunities

Process Classifications Detailed description Risks/opportunities to address
Transition risks
Physical risks
Opportunities
Policy and legal
Technology Market Reputation Acute Chronic Resource efficiency
Energy source
Products/services
Markets Resilience
Raw material production and procurement
■ Sustainable agriculture
  • Obtaining RSPO certification and supporting farmers’ commitment to NDPE.
  • Supporting and adopting drought- and heat-tolerant plant resource production.
  • Supporting and adopting plant resource production adapted to climate change.
■ Sustainable procurement
  • Expanding traceability to plantations through stronger relationships with suppliers (especially for palm oil).
  • Regular inspections to strengthen cooperation with plantations and oil mills and ensure compliance with laws and regulations.
  • Expanding the scope of RSPO supply chain certification and preparing to acquire MSPO and ISPO certified oil to achieve 100% certified palm oil.
  • Promoting sustainable procurement of major raw materials other than palm oil (e.g., soybean, rapeseed, cacao).
■ Stabilizing raw material prices and supply
  • Diversifying suppliers, deconcentrating, and developing new raw material production areas, and promoting multiple varieties of raw material crops.
  • Strengthening relationships with farmers and oil mills by working together to adapt to climate change and improve raw material quality.
  • Asking suppliers to take measures against wind and flood damage and establish BCPs, and conducting support activities.
  • Considering cost control through joint transport of imported raw materials.
Research and development ■ Researching and developing alternatives and new functions
  • Establishing an Incubation Center (tentative name) to accommodate changing customer and consumer needs.
  • Acquiring new oil and meal resources and functional materials (microalgae and other non-grain meal resources).
  • Researching and developing products that can contribute to measures against lifestyle diseases, undernutrition, and frailty.
  • Researching and developing meat and milk substitutes made from vegetable oils, fats, and proteins.
  • Promoting reduced plastic usage and volume, plastic recycling, and development of alternative containers.
Manufacturing ■ Resource efficiency in production processes
  • Transitioning to rigorous energy conservation activities and energy-efficient equipment, and increasing the ratio of non-fossil energy use.
  • Considering and preparing to adopt new technologies (e.g., hydrogen energy) that contribute to decarbonization.
  • Introducing internal carbon pricing and reflecting it in decision-making for capital investment and the like.
  • Reducing water consumption (intake, use, and discharge) through rigorous water conservation and introducing water recycling systems.
■ Expanding sustainable products
  • Increasing production capacity of value-added esters and establishing facilities adapted for cosmetics certification.
  • Expanding production of plant material-based UV care products and other related products.
  • Expanding market size and production volumes by expanding items and promoting the functions of long-lasting products based on CFP.
■ Measures against wind and flood damage for production plants
  • Reinforcing production facilities and upgrading shore protection in preparation for major climate disasters.
  • Regularly reviewing and continuously strengthening BCPs.
Logistics ■ Reducing greenhouse gas emissions
  • Promoting joint delivery of products by cooperating with other companies and a modal shift in consideration of transport efficiency.
  • Reducing the number of shipments by improving loading rates and optimizing plant delivery networks.
Sales ■ Fostering customer and consumer understanding
  • Promoting sales strategies that reflect the added value and brand value of certified oils.
  • Enhancing product competitiveness by increasing product sustainability and visualizing CFP and other environmental impacts.
  • Raising awareness of certified raw materials through public education activities in collaboration with government and industry associations.
  • Promoting proactive marketing activities advocating decarbonization.
Waste ■ Promoting resource recycling
  • Investing in companies that develop recycling technologies for plastic raw materials.
  • Utilizing food by-products as renewable energy sources (biomass fuel, methane gas).
  • Reducing waste by managing supply and demand balance based on analysis of consumer preferences.

* Detailed descriptions include actions in progress and under consideration

  • In all processes from producing to procuring raw materials, we promote the production of certified oils and other sustainable raw materials and the expansion of traceability by strengthening engagement with local farmers. We also strive to improve sustainability in our purchasing activities by hedging risks through diversification of suppliers and using plant resources adapted to climate change.
  • In research and development, we will establish an “Incubation Center” to accommodate customer and consumer needs, look beyond existing raw materials to acquire new meal resources and functional materials, and develop health-enhancing products, food products made from vegetable proteins, and alternatives to plastic containers for fossil-free raw materials.
  • In manufacturing processes, we promote the efficient use of energy, water, and other resources, reinforce production to accommodate changing customer and consumer needs, and strengthen measures against windstorms, floods, and other natural disasters, which are becoming more severe and frequent due to climate change.
  • In logistics processes, we make efforts to reduce greenhouse gas emissions by expanding joint delivery networks utilizing networks with other companies and promoting energy-efficient rail transportation and other modal shifts to achieve carbon neutrality and comply with carbon taxes and other laws and regulations.
  • In sales processes, we promote proactive marketing utilizing environmental value, and improve the Group’s brand image by visualizing the environmental impact of our products and services and by promoting and educating the public about sustainability-conscious certified raw materials.

(3) Risk management

  • The Risk Management Committee established by the Board of Directors selects major financial and strategic risks to our business and manages physical and transition risks associated with climate change.
  • The committee evaluates major risks by analyzing the level of impact and likelihood of occurrence for the entire Group, classifying their findings into three levels of importance for each. The committee also considers short-, medium-, and long-term timelines. Figure 3 below shows the Group’s major risks selected by the Risk Management Committee. Accordingly, the committee manages climate change-related risks together with other risks.

▼ Figure 3: Risk map

  • Relevant departments are identified for significant risks and undergo the PDCA cycle to manage them and respond in emergencies. The status of risk response is evaluated through reporting by the Risk Management Committee to the Board of Directors and monitoring by the Audit & Supervisory Board.

(4) Indicators and goals

  • The Group’s existing climate-related goals include CSV goals and Environmental Targets for 2030.
  • We have identified reducing greenhouse gas emissions as a measure against climate change, and have set new goals in 2023: reducing Scope 1 and 2 emissions by 50% by fiscal 2030 (compared with fiscal 2016) on a total volume basis, and reducing Scope 3 emissions from purchased products, services, transport, and delivery (upstream) by 25% (compared with fiscal 2020). These goals align with the Paris Agreement and Japan’s nationally determined contribution (NDC) thereunder. We underwent third-party verification of greenhouse gas emissions in 2022, and will continue and expand efforts in the future.
  • Based on our roadmap for decarbonization to achieve carbon neutrality, we are aiming to reduce Scope 1 and 2 emissions by introducing high-efficiency equipment and converting to solar, hydrogen, and other non-fossil energy sources, and Scope 3 emissions through supply chain initiatives. We disclose our Scope 1, 2, and 3 emissions and the assumptions used to calculate them in our Integrated Report (Sustainability Data Book). Notably, we have taken internal carbon pricing (ICP) into account in decision-making for capital investment and the like since fiscal 2021.
  • As for other climate-related goals, we control water quality in accordance with laws and regulations and aim to reduce our water consumption per unit in production activities by 16% by 2030 compared with fiscal 2016. Regarding waste reduction, we are limiting waste through the environmentally conscious development of various products such as lightweight containers and long-lasting products, and we are recycling waste by introducing biomass boilers that run on production process by-products and striving for zero actual emissions.

▼ Table 6: Environmental Targets for 2030

Theme Target  
FY2021 actual FY2022 actual FY2023 actual FY2024 actual Revised target for FY2030
Preventing global warming  Reduce greenhouse gas emissions in the supply chain
  • • Reduce Scope 1 and 2 CO2 emissions
-7.3%
compared with FY2016
-8.6%
compared with FY2016
-18.6%
compared with FY2016
-20.7%
compared with FY2016
-50%
compared with FY2016
  • • Reduce Scope 3 CO2 emissions
  • • Set action targets for emissions reduction
  • • Expanded scope of calculation to include The Nisshin OilliO Group, Ltd., Intercontinental Specialty Fats Sdn. Bhd.
  • • Obtained third-party verification of CO2 emissions
  • • Set quantitative targets for FY2030
  • • Began detailed discussions with US and Canadian industry groups via the Japan Oilseed Processors Association (JOPA) on methods of calculating CO2 emissions from main raw materials (soybean, rapeseed) (September)
  • • Obtained third-party verification of CO2 emissions
  • • Held detailed discussions with Canadian industry groups via the JOPA on methods of calculating CO2 emissions; conducted interviews with Brazilian industry groups
  • • Utilized environmentally conscious vessels (docked at Nagoya Plant in November)
  • • Requested cooperation from suppliers to visualize and reduce CO2 emissions
  • • Obtained third-party verification of CO2 emissions
-25%
(starting with Categories 1 and 4)
compared with FY2020
  • • Implement environmental education and promote the reduction of CO2 emissions through business operations by each and every employee
 Promote the use of renewable energy
  • • Promote the use of renewable energy at the Sakai Plant
  • • Decided to install a solar power generation system at the Sakai Plant
  • • Installed a solar power generation system at the Sakai Plant
  • • Reduced CO2 emissions by 179 t-CO2 through solar power generation at the Sakai Plant
  • • Reduced CO2 emissions by 223 t-CO2 through solar power generation at the Sakai Plant
  • • Reduced CO2 emissions by 476 t-CO2 through procurement of non-fossil certificates equivalent to the electricity used for food product-filling at the Sakai Plant
100%
  • • Expand efforts led by the Sakai Plant to other plants and Group companies
  • • Decided to install solar power generation systems at the Yokohama Isogo Plant and the Nagoya Plant
  • • Installed solar power generation systems at the Yokohama Isogo Plant and the Nagoya Plant
  • • Reduced CO2 emissions by 245 t-CO2 through solar power generation at the Yokohama Isogo Plant and the Nagoya Plant
  • • Reduced CO2 emissions by 275 t-CO2 through solar power generation at the Yokohama Isogo Plant and the Nagoya Plant
Establishing resource recycling  Promote recycling in production processes
  • • Recycling rate in production processes
99.8% 99.8% 99.9% 99.6% At least 99%
  • • Effectively use by-products from edible oil production
  • • Formulated a plan to install a biomass boiler at the Sakai Plant
  • • Installed a biomass boiler at the Sakai Plant
  • • Reduced CO2 emissions by 351 t-CO2 through biomass boiler operation at the Sakai Plant
  • • Reduced CO2 emissions by 468 t-CO2 through biomass boiler operation at the Sakai Plant
 Efficiently use water resources for production
  • • Reduce our water consumption intensity in production activities
-13.1%
compared with FY2016
-15.4%
compared with FY2016
-10.8%
compared with FY2016
-9.5%
compared with FY2016
-14%
compared with FY2016
Plant resources/nature conservation  Promote sustainable raw material procurement
• Promote sustainable palm oil procurement
  • • Increase the percentage of certified palm oil
54.9% (Jan–Dec 2021) 59.6% (Jan–Dec 2022) 66.9% (Jan–Dec 2023) 77.7%(Jan–Dec 2024)
100%
  • • Increase the SG ratio of RSPO certified oil
49.6% (Jan–Dec 2021) 51.1% (Jan–Dec 2022) 56.3% (Jan–Dec 2023) 70.5% (Jan–Dec 2024)
50%
  • • Establish a system to ensure traceability to plantations, aiming for 100% traceability
Palm oil: 68.5%
Palm kernel oil: 30.5%
Palm oil: 90.9% Palm oil: 92.7% Palm oil: 92.9% Palm oil: 100%
  • • Promote efforts to increase soybean sustainability
  • • Conducted a fact-finding survey on Brazilian soybean, considered joining the Round Table on Responsible Soy Association (RTRS), etc.
  • • Established Soybean Procurement Policy
  • • Formulated an action plan based on traceability, Scope 3 emissions reduction, etc.
  • • Began engaging in dialogue with suppliers and producer organizations (in collaboration with JOPA and others, preparing to join RTRS)
  • • Explained the Supplier Guidelines to suppliers and conducted a CSR questionnaire
  • • Began considering soybean procurement that enables the visualization of CO2 emissions during soybean production
  • • Considered procurement of RTRS-certified and traceable soybeans
Sustainable soybean procurement predicated on stable supply
  • • Promote sustainable cacao procurement
  • • Conducted a survey on the conditions of production areas and customer needs
  • • Established Cacao Action Plan
  • • Formulated an action plan based on cacao procurement traceable to plantations, release of products made from certified cacao, conservation of rare beans, etc.
  • • Began procuring Nigerian cocoa beans that are traceable to plantations and are part of environmental and human rights support programs
Sustainable cacao procurement predicated on stable supply
 Promote natural conservation activities
  • • Promote afforestation, etc.
  • • Planted mangrove trees (roughly 0.14 ha, 365 trees) in Malaysia
  • • Planned to expand scale in 2022 and onward
  • • Planted mangrove trees (2 ha) in Malaysia
  • • Planted mangrove trees (1.5 ha, 3,000 trees) in Malaysia
  • • Planted mangrove trees (0.5 ha, 1,000 trees) in Malaysia
Promoting environmentally conscious development Reduce plastic containers/packaging and promote resource recycling
  • • Develop product designs and new containers that reduce plastic use
  • • Discussed the course of action in response to the problems of plastic
  • • Strengthened production system for environmentally conscious containers
  • • Released three paper container products (Canola Oil, Canola Oil Halfuse, and Healthy Sesame Fragrant Oil)
  • • Introduced new containers with 30% recycled PET plastic and 39% less plastic than conventional bottles, released eight new products
  • • Released one paper container product (Light Rice Bran Oil)
  • • Introduced new delaminated “keep fresh” bottle containers (approx. 19% less plastic than conventional bottles), released five new products
  • • Worked with Kewpie to demonstrate that used PET bottles that once contained oil can be recycled into product containers
  • • Introduced partially recycled PET plastic in the household-use category (200-g PET bottles), released two new products
  • • Development and realization of systems for containers, technologies, and services conducive to resource recycling
  • • Reduction ratio of petroleum-based plastic used for containers (bottle/cap): 15% (compared with FY2022)
  • • Develop easily recyclable containers and technologies to facilitate recycling, and establish a recycling system
  • • Decided to invest in an environmentally conscious container filling line at the Sakai Plant
  • • Collaborated with the City of Kawasaki on an experiment to collect used plastic containers for edible oil and seasonings from households
  • • Promote the use of recycled materials and plant-derived materials as alternatives to facilitate recycling
  • • Planned to introduce biopolyethylene in products in the household-use category (1,000-g polyethylene bottles)
  • • Introduced biopolyethylene in products in the household-use category (1,000-g polyethylene bottles)
 Develop products/services that use plant resources and have a positive environmental impact
  • • Develop products and applications that have a positive impact on the environment in the food and industrial domains
  • • Developed 10 products that have a positive environmental impact
  • • Developed new approaches and proposals for industrial applications (e.g., lubricants, inks, adhesives)
  • • Developed 15 products that have a positive environmental impact
  • • Cumulative: 41 products
  • • Developed and released long-lasting oils, plant-based industrial oils and fats, etc. for reducing food loss
  • • Cumulative: 54 products
  • • Expanded adoption of our products as mineral oil substitutes and in other new industrial applications; promoted development of products that contribute to food loss, plant-based and environmentally conscious cosmetic ingredients, etc.
Products/services that have a positive environmental impact become the core driving force of growth

▼ Table 8: Risks and opportunities arising from impacts on nature, and existing measures

Impact factors Value chain Risks Opportunities Relevant Group environmental target themes Response (existing measures) AR3T
Upstream Direct
operations
Downstream
Climate change GHG emissions
  • Tighter regulations for GHG emissions reduction
  • Increased demand for fossil fuel alternatives
  • Reduce transport costs by promoting optimization of logistics for emissions reduction
  • Capture new sales opportunities from demand for fossil fuel alternatives
  • Improve resilience on GHG issues by acquiring new oil and meal resources and functional materials and reducing emissions
Preventing global warming
  • Reduce GHG emissions in the supply chain
  • Promote the use of renewable energy in our manufacturing processes
Reduce
  • Adopt new technologies (e.g., hydrogen energy) that contribute to decarbonization in our manufacturing processes
Avoid
Changes in land,
freshwater &
ocean use
Terrestrial ecosystems
  • Tighter regulations on farmland development and deforestation
  • Increased demand for environmentally conscious raw materials due to tighter regulations
  • Changing consumer preferences
  • Achieve 100% traceability of palm oil to plantations to improve raw material transparency and expand sales opportunities
  • Increase market share and sales by expanding sales of products made from certified raw materials
  • Expand sales opportunities on the strength of increased demand for plant-based foods
Plant resources/nature conservation
  • Promote procurement of sustainable raw materials (certified palm, certified soybeans)
Avoid
  • Promote certification support for oil palm smallholders
Avoid
  • Promote natural conservation activities by planting mangrove trees in Malaysia, etc.
Restore & Regenerate
Pollution &
decontamination
Soil & water contaminants
  • Tighter regulations on pesticide and chemical fertilizer use in raw material production
  • Increase revenues from offering certified sustainable products
  • Improve market valuation by practicing environmentally regenerative farming
Plant resources/nature conservation
  • Promote procurement of sustainable raw materials (certified palm, certified soybeans)
Avoid
  • Promote sustainability of cacao flavors in Ecuador to boost disease resistance and productivity
Reduce
Solid waste
  • Tighter regulations on plastic use and disposal
  • Necessity of developing new technologies to reduce waste generated from manufacturing processes and products
  • Changing consumer preferences
  • Reduce plastic use by introducing recycled and plant-derived materials in food packaging
  • Reduce plastic use by establishing a system for recycling used plastic bottles that contained oil
  • Reduce food loss by extending the shelf life of household cooking oil
  • Create new business by effectively utilizing oil cakes, spent bleaching clay, and other by-products
Establishing resource recycling

Promoting environmentally conscious development
  • Reduce plastic containers/packaging and promote resource recycling
Reduce
  • Promote recycling in our manufacturing processes
Reduce
Non-GHG air pollutants
  • Tighter regulations on emissions
  • Increased impact of acid rain caused by air pollutants
  • Reduce air pollutant emissions by introducing low-emission vehicles
  • Reduce transport costs by promoting optimization of logistics for air pollutant reduction
Preventing global warming
  • Introduce low-emission vehicles for transporting products
Avoid
  • Conduct environmental assessments and provide feedback to delivery companies
Avoid
  • Jointly deliver products, promote modal shift
Reduce
Resource use &
replenishment
Water
  • Conflicts with local communities involving water rights
  • Depletion of water resources
  • Reduce drought risk and costs through efficient water use during production
Establishing resource recycling
  • Reduce our water consumption intensity at four manufacturing plants in Japan
Reduce
  • Dependencies and impacts on natural capital (plants, animals, air, soil, and water) and the risks and opportunities arising from them are closely related to the theme of the Group’s environmental targets; therefore, we are already disclosing indicators, setting targets, and taking action to achieve these targets in due order. In the future, we will further incorporate the issues identified through this approach and enhance our response to steadily progress toward achieving our environmental targets. We will also identify priority areas, assess the significance of risks and opportunities, and take other steps to consider and expand necessary measures, including areas that are not currently being addressed.
  • Additionally, when we respond to risks and opportunities, we are required to take action based on the AR3T Action Framework*5. We will consider additional initiatives based on this framework.
  • *5 A framework proposed by the Science Based Targets Network (SBTN) that prioritizes and organizes corporate actions to minimize negative impacts on nature, reduce nature-related risks, clarify positive impacts on nature, and identify new business opportunities. The AR3T Action Framework requires companies to take action to Avoid, Reduce, Restore & Regenerate, and Transform, in that order.

▼ Table 9: CSV goals for our priorities

Priorities CSV goals Results in each fiscal year
FY2030 FY2021 FY2022 FY2023 FY2024
Good health for all Vision: Underpinning the era of 100-year lifespans by contributing to mental and physical health
Specific effort: Provide products and services that utilize our extensive knowledge of lipid nutrition
Increase the growth rate of health science products*1 that generate health and energy at different life stages (compared with FY2019) 200% 112% 127% 133% 143%
Develop products to improve health issues by utilizing our lipid nutrition knowledge*2 Acquire evidence and develop products for resolving personal health issues (improving and controlling physical condition) Released new foods with functional claims Launched 11 products, including food with the functional claim of “reducing body fat and waist size” and nutritional supplements
  • Acquired six pieces of evidence involving “fat burning” burning and preventing undernutrition and frailty (MCTs)
  • Released nine products, including small-quantity, high-energy products
  • Acquired five pieces of evidence involving “fat burning,” preventing frailty (maintaining leg muscle strength of middle-aged and elderly people), reducing fatigue, etc.
  • Released or updated six products promoting “fat burning,” nutritional supplementation, etc.: 35 products in total since FY2022
Expand the number of people provided with health information to promote optimal lipid intake (cumulative total since FY2021)*3 Cumulative: 400 million 8.08 million Cumulative: 34.84 million Cumulative: 89.41 million Cumulative: 150 million
Quality of life Vision: Contributing to the realization of a more enhanced quality of life through the pursuit of Good Flavor and Beauty
Specific effort: Provide oils & fats as our products and services that offer Good Flavor and Beauty
Refine brands to offer a higher quality of life through Good Flavor for foods Corporate brand awareness: 90% Promoted the creation of new flavored oil categories Promoted the development of products that utilize the Company’s specialized technologies Released Nisshin Healthy Clear, made with our ultra oxidation barrier manufacturing method that thoroughly inhibits oil oxidation, in spring 2024 Released new products that taste good and are healthy and otherwise enjoyable to counter the expanded rice bran oil market, soaring olive oil prices, etc.
Create products that pursue Good Flavor and Beauty Further contribute to food enrichment by creating new categories based on edible oils Released flavored oil products Launched six flavored oil products as products to spread a new way of using oil to add flavor Expanded awareness by introducing new flavored oil products and developing promotions (awareness: 25%)
  • Introduced new products to revitalize the flavored oil market
  • The flavored oil market size: 168% YoY
Increase the growth rate of beauty-enhancing products*4 (compared with FY2019) 200% 105% 127% 126.6% 146%
Global environment Vision: Tackling challenges to pass on the global environment to the next generation
Specific effort: Maintain a planet where plants can grow and people can live healthy lives
Reduce Scope 1 and 2 CO2 emissions (compared with FY2016)*1 50% 7.3% 8.6% 18.6% 20.7%
Reduce Scope 3 CO2 emissions (compared with FY2020, starting with Categories 1 and 4) 25% Calculated the past results and set targets for FY2022 and beyond Promoted the setting of quantitative targets in collaboration with the Japan Oilseed Processors Association (JOPA) for ensuring reductions in CO2 through the Canada-Japan Canola Consultations and the U.S.-Japan Partnership program
  • Set quantitative targets for FY2030
  • Began detailed discussions in September with US and Canadian industry groups via the JOPA on methods of calculating CO2 emissions from main raw materials (soybean and rapeseed)
  • Held detailed discussions with Canadian industry groups via the JOPA on methods of calculating CO2 emissions; conducted interviews with Brazilian industry groups
  • Utilized environmentally conscious vessels (docked at Nagoya Plant in November)
  • Requested cooperation from suppliers to visualize and reduce CO2 emissions
Reduce plastic containers/packaging and promote resource recycling
  • Develop and realize systems for containers, technologies, and services conducive to resource recycling
  • Reduce ratio of petroleum-based plastic used for containers (bottle/cap) made from petroleum: 15% (compared with FY2022)
Discussed our course of action and decided on relevant investments
  • Introduced bio-polyethylene into some of the household-use products (1,000 g)
  • Enhanced our environmentally conscious container production system
  • Released three paper container products (Canola Oil, Canola Oil Half-use, and Healthy Sesame Fragrant Oil)
  • Introduced new containers with 39% less plastic than conventional bottles and partially made from recycled PET plastic, and released eight new products
  • Achieved a 52% introduction rate of environmentally conscious materials in products in the household-use category
  • Reduced ratio of petroleum-based plastic used for containers (bottle/cap) by 3.9%
Develop products/services that use plant resources and the Company’s technology and have a positive environmental impact (cumulative total since FY2021) Make products/ services that have a positive environmental impact become the core driving force of growth 10 products Cumulative: 28 products/services Cumulative: 41 products/services
(Developed and released long-lasting oils, plant-based industrial oils and fats, etc. for reducing food loss)
Cumulative: 54 products/services
Expanded adoption of our products as mineral oil substitutes and in other new industrial applications; promoted development of products that contribute to food loss, plant-based and environmentally conscious cosmetic ingredients, etc.
Contribution to the food value chain Vision: Working with customers to refine our technologies, products, and services for enhanced value
Specific effort: Refine technologies, products, and services together with customers
Stably supply food energy in Japan (percentage of total domestic energy) 6% or more 7.5% 7.5% 7.3% 7.6%
Provide solutions by demonstrating product application development functions
Increase the number of cases (compared with FY2019)
150% 83% 112% 127% 131%
Make other efforts, progress, and results - - Started extending the shelf lives of some products in the household-use category from 18 months to 25 months in spring 2023 Began participating in industry-academia-government collaboration projects to acquire new meal resources and functional materials (development of alternative algae-based lipids) Began operations of Incubation Square, a hub for co-creation with customers, in May (Number of visits: 161)
Supply chain connected by trust Vision: Building a strong, resilient supply chain that values integrity
Specific effort: Contribute to building a sustainable supply chain from upstream to downstream
Advance and fortify business operations based on respect for human rights Lay the groundwork and establish mechanisms to prevent human rights violations in the supply chain - Disseminated our human rights policy throughout the Group, and began operations on human rights due diligence Established Supplier Guidelines, began providing guidance to high-priority suppliers, administered an SAQ*6 and made site visits to manufacturing contractors Administered an SAQ to high-priority suppliers and logistics providers of soybean, rapeseed, and palm oil
Improve traceability to plantations Palm oil:
100%
Palm oil:
68.5%
Palm oil:
90.9%
(January–December)
Palm oil:
92.7%
(January–December)
Palm oil:
92.9%
(January–December)
Promote sustainable soybean procurement Sustainable soybean procurement predicated on stable supply Conducted a fact-finding survey and considered joining the RTRS*7 Formulated and announced a Soybean Procurement Policy
  • Formulated an action plan based on traceability, Scope 3 emissions reduction, etc.
  • Began engaging with suppliers and producer organizations (collaborated with the JOPA and other organizations and prepared for joining the RTRS)
  • Explained the Supplier Guidelines to suppliers and conducted a CSR questionnaire
  • Began considering soybean procurement that enables the visualization of CO2 emissions during soybean production
  • Considered procurement of RTRS-certified and traceable soybeans
Promote sustainable cacao procurement Sustainable cacao procurement predicated on stable supply Conducted a survey on the conditions of production areas and customer needs Formulated and announced a Cacao Procurement Policy Formulated an action plan based on cacao procurement traceable to plantations, release of products made from certified cacao, conservation of rare beans, etc. Began procuring Nigerian cocoa beans that are traceable to plantations and are part of environmental and human rights support programs
Establish a sustainable, competitive logistics system Increase the F-LINE co-distribution rate to make transport and loading more efficient 30% - 14% 14% 14%
Reduce the truck drivers’ time spent at Company plants Average: Within 30 minutes - Average: 88 minutes (as of March 2024) Average: 65 minutes (as of March 2025)
Human resource management Vision: Enhancing fulfillment among diverse human resources to improve organizational capacity and drive innovation
Specific effort: Improve the organizational capabilities and job satisfaction of diverse human resources
Resonate with the Group’s philosophy and vision Increase the resonance index for the Group’s Corporate Philosophy and Vision 2030 (★) 95% or more of employees resonating
25% or more of core group resonating strongly
- 93.9% of employees resonating
13.3% of core group resonating strongly
Build a strong workforce Maintain and expand annual training and education expenditure per full-time employee as a proactive investment in human resource development ¥95,000 or more ¥34,000 ¥52,000 ¥78,000 ¥72,000
Leverage diverse talent Expand employees’ growth-oriented mindset and sense of growth through work (★) Growth-oriented: 95% or more
Sense of growth: 90% or more
- Growth-oriented: 95%
Sense of growth: 80.5%
Increase the percentage of management positions held by women (non-consolidated)*8 20% 5.0% 6.3% 7.3% 8.4%
Evolve into an organizational culture that creates innovation Increase the percentage of employees who feel fulfilled at work 80% or more - 69.9%
Reference: Non-consolidated Company figures 64.6% 63.0% 65.5% 68.7%
  • *1 MCT oil and processed foods, healthy oils, supplement-type oils, wellness foods, and other products that can contribute to measures against lifestyle-related diseases/disorders, frailty, and other maladies.
  • *2 Products that can contribute to resolving undernutrition, overnutrition, and personal health issues.
  • *3 Health information about lipids refers to information that helps improve on undernutrition and overnutrition and resolve personal health issues, and leads to correct understanding and increased value of oils and fats.
  • *4 Cosmetic ingredients (including products of IQL and NOST), health and sanitation management business of Settsu Inc.
  • *5 Calculated using the latest emission factor at the time of drafting the report.
  • *6 SAQ: Self-Assessment Questionnaire
  • *7 RTRS: Round Table on Responsible Soy Association
  • *8 Base date: April 1 of the following fiscal year.

▼ Figure 4: Strategic roadmap to promote decarbonization (transition plan)