Efforts for health management

For The Nisshin OilliO Group, the employees are the greatest asset, and maintaining and promoting the physical and mental health of our employees and their families is an investment of utmost importance in our business. Accordingly, we established the Health Management Declaration in 2017. Healthy employees are the foundation of corporate management, and are essential for improving performance, preventing productivity loss due to illness, and providing customers with a stable supply of safe, reliable products. We will continue to provide support for our employees to maintain and improve their health so that each and every employee can work with a sense of fulfillment and vitality and lead a healthy, prosperous life.

Health Management Declaration

The health of our employees is the very foundation of their happiness and that of their families. It is also the most important asset for the sustainable development of the Company. Based on our Corporate Philosophy of developing business in pursuit of good flavor, health, and beauty, we will help employees maintain and improve their health with the aim of fostering a workplace where every employee is energetic and enthusiastic. The Nisshin OilliO Group hereby declares that it will further enhance its corporate value and contribute to society through health management.

Health management promotion system

The Nisshin OilliO Group’s health management is led by top management, who serves as the chief health management officer, and is carried out by the dedicated Health and Productivity Management Department in collaboration with each business location and health insurance society, with the entire company working together as one. Additionally, since FY2020, health promotion teams have been established at each of our business locations to strengthen participatory initiatives. These teams formulate and implement plans designed specifically for their locations and strongly promote the deployment of Company-wide measures.

Health and Productivity Management Strategic Map

The Company implements measures that help solve health issues using the Health and Productivity Management Strategic map, which organizes the relationship between goals (improving employee performance and achieving happiness) and measures in health management.

Health and Productivity Management Strategic Map

Key initiatives

  • Preventing lifestyle-related diseases/disorders

    To prevent lifestyle-related diseases/disorders, we must improve our indexes pertaining to obesity, blood pressure, blood sugar, and lipids. To reduce the risk of diseases/disorders among employees, we will make efforts to help improve their dietary habits and exercise routines.

  • Promoting smoking cessation

    Smoking is a critical risk factor associated with cancer and many other diseases. The percentage of smokers in the Company has decreased over the years, but to promote further smoking cessation, we will make efforts to subsidize the cost of quitting, provide information, raise awareness, and improve the non-smoking environment.

  • Supporting mental health

    We are committed to promoting the mental health of our employees so that they can maintain their mental well-being, maximize their diverse personalities and abilities, and continue to work with vitality.

Health indicators

We monitor indicators over time to undergo the PDCA cycle for each initiative. Our health management measures have increased employees’ fulfillment and held absenteeism to a low level, leading to higher productivity.

Key task Health indicators for achieving the task FY2019
Results
FY2020
Results
FY2021
Results
FY2022
Results
FY2023
Results
FY2024
Targets
Prevent lifestyle-related diseases/disorders [Reduce the percentage of employees at risk of obesity]*1
Percentage of employees with BMI of 25 or higher
30.4% 30.1% 29.3% 29.1% 29.2% 25.0%
[Reduce the percentage of employees at risk of hypertension]*1
Percentage of employees with systolic blood pressure of 130 mm Hg or higher, or diastolic blood pressure of 85 mm Hg or higher
35.5% 34.4% 32.4% 32.8% 36.4% 33.0%
[Reduce the percentage of employees at risk of diabetes]*1
Percentage of employees with fasting blood sugar level of 100 mg/dL or greater, or HbA1c (NGSP value) of 5.6% or greater
45.2% 41.0% 40.0% 39.9% 40.8% 34.0%
[Reduce the percentage of employees at risk related to blood lipid level]*1
Percentage of employees with triglycerides of 150 mg/dL or greater, or HDL cholesterol of 40 mg/dL or less
22.7% 20.3% 20.8% 19.9% 19.8% 19.0%
[Increase the percentage of employees who are regular exercisers]
Employees who exercise at least 30 minutes one or more times a week
37.7% 35.9% 37.1% 37.0% 45.8% 45.0%
Improve employees’ completion rate of metabolic syndrome-specific health guidance 100% 98.3% 98.6% 100% - 100%
Promote smoking cessation Reduce smoking rates 24.0% 22.8% 21.9% 21.2% 20.4% 16.0%
Support mental health Increase the percentage of employees who sleep an average of at least 6 hours/night 42.6% 47.7% 47.4% 46.9% 72.2% 75.0%
Obtain 90% or higher percentage of employees with a stress check test score of A or B 87.7% 90.5% 88.3% 88.5% 87.9% 91.0%
Obtain full participation in medical examinations and stress checks Maintain 100% rate of employees receiving medical examinations 100% 100% 100% 100% 100% 100%
Increase the percentage of employees receiving stress checks 96.3% 95.7% 97.5% 97.5% 98.4% -
Increase the percentage of employees’ family members receiving metabolic syndrome-specific health checkups (dependents age 40 and older) 61.6% 71.1% 70.6% 77.3% 76.1% 70.0%
Increase the percentage of employees receiving thorough examinations - 76.7% 88.4% 79.1% 81.7% 90.0%
Treatment retention rate - - - - 65.6% -
Improve performance

Prevent productivity decline
[Increase engagement in work]
Percentage of employees who feel fulfilled at work*2
63.7% 67.2% 64.6% 63.0% 65.5% 70.0%
[Reduce absenteeism]
Average number of days of leave taken, absences, or leaves of absence due to injury or illness
1.41 days 1.16 days 1.80 days 2.59 days 2.63 days 1.00 day
Percentage of full-time employees with long-term absences or leave taken for injury or illness*3 0.24% 0.39% 0.38% 1.00% 0.97% -
[Improve on presenteeism]
SPQ (the University of Tokyo one-item version) (average for all employees)*2
- - 87.1% 86.9% 87.8% 90.0%
[Improve health literacy]
Percentage of employees who are consistently aware of their own health and make efforts to promote their own health*2
- - 59.3% 55.9% 56.9% 60.0%

Key taskPreventing lifestyle diseases

Health indicators for achieving the task
[Reduce the percentage of employees at risk of obesity]*1
Percentage of employees with BMI higher than 25
FY2019
Results

30.4%
FY2020
Results

30.1%
FY2021
Results

29.3%
FY2022
Results

29.1%
FY2023
Results

29.2%
FY2024
Targets

25.0%
Health indicators for achieving the task
[Reduce the percentage of employees at risk of hypertension]*1
Percentage of employees with systolic blood pressure over 130 mm Hg or diastolic blood pressure over 85 mm Hg
FY2019
Results

35.5%
FY2020
Results

34.4%
FY2021
Results

32.4%
FY2022
Results

32.8%
FY2023
Results

36.4%
FY2024
Targets

33.0%
Health indicators for achieving the task
[Reduce the percentage of employees at risk of diabetes]*1
Percentage of employees with fasting blood sugar level greater than 100 mg/dL or HbA1c (NGSP value) greater than 5.6%
FY2019
Results

45.2%
FY2020
Results

41.0%
FY2021
Results

40.0%
FY2022
Results

39.9%
FY2023
Results

40.8%
FY2024
Targets

34.0%
Health indicators for achieving the task
[Reduce the percentage of employees at risk related to lipids]*1
Percentage of employees with triglycerides greater than 150 mg/dL or HDL cholesterol less than 40 mg/dL
FY2019
Results

22.7%
FY2020
Results

20.3%
FY2021
Results

20.8%
FY2022
Results

19.9%
FY2023
Results

19.8%
FY2024
Targets

19.0%
Health indicators for achieving the task
[Increase the percentage of employees who are regular exercisers]
Employees who exercise at least 30 minutes at least once a week
FY2019
Results

37.7%
FY2020
Results

35.9%
FY2021
Results

37.1%
FY2022
Results

37.0%
FY2023
Results

45.8%
FY2024
Targets

45.0%
Health indicators for achieving the task
Improve employees’ completion rate of metabolic syndrome-specific health guidance
FY2019
Results

100%
FY2020
Results

98.3%
FY2021
Results

98.6%
FY2022
Targets

100%
FY2023
Results

-
FY2024
Targets

100%

Key taskPromoting smoking cessation

Health indicators for achieving the task
Reduce smoking rates
FY2019
Results

24.0%
FY2020
Results

22.8%
FY2021
Results

21.9%
FY2022
Results

21.2%
FY2023
Results

20.4%
FY2024
Targets

16.0%

Key taskSupporting mental health

Health indicators for achieving the task
Increase the percentage of employees who sleep an average of at least 6 hours/night
FY2019
Results

42.6%
FY2020
Results

47.7%
FY2021
Results

47.4%
FY2022
Results

46.9%
FY2023
Results

72.2%
FY2024
Targets

75.0%
Health indicators for achieving the task
Percentage of employees with a stress check test score of A or B of at least 90%
FY2019
Results

87.7%
FY2020
Results

90.5%
FY2021
Results

88.3%
FY2022
Results

88.5%
FY2023
Results

87.9%
FY2024
Targets

91.0%

Key taskFull participation in medical examinations and stress checks

Health indicators for achieving the task
Maintain 100% rate of employees receiving medical examinations
FY2019
Results

100%
FY2020
Results

100%
FY2021
Results

100%
FY2022
Results

100%
FY2023
Results

100%
FY2024
Targets

100%
Health indicators for achieving the task
Increase the percentage of employees receiving stress checks
FY2019
Results

96.3%
FY2020
Results

95.7%
FY2021
Results

97.5%
FY2022
Results

97.5%
FY2023
Results

98.4%
FY2024
Targets

-
Health indicators for achieving the task
Increase the percentage of employees’ family members receiving metabolic syndrome-specific health checkups (dependents age 40 and older)
FY2019
Results

61.6%
FY2020
Results

71.1%
FY2021
Results

70.6%
FY2022
Results

77.3%
FY2023
Targets

76.1%
FY2024
Targets

70.0%
Health indicators for achieving the task
Increase the percentage of employees receiving thorough examinations
FY2019
Results

-
FY2020
Results

76.7%
FY2021
Results

88.4%
FY2022
Results

79.1%
FY2023
Results

81.7%
FY2024
Targets

90.0%
Health indicators for achieving the task
Treatment retention rate
FY2019
Results

-
FY2020
Results

-
FY2021
Results

-
FY2022
Results

-
FY2023
Results

65.6%
FY2024
Targets

-

Key taskImproving performance and preventing productivity loss

Health indicators for achieving the task
[Increase engagement in work]
Percentage of employees who feel fulfilled at work*2
FY2019
Results

63.7%
FY2020
Results

67.2%
FY2021
Results

64.6%
FY2022
Results

63.0%
FY2023
Results

65.5%
FY2024
Targets

70.0%
Health indicators for achieving the task
[Reduce absenteeism]
Average number of days of leave taken, absences, or leaves of absence due to injury or illness
FY2019
Results

1.41 days
FY2020
Results

1.16 days
FY2021
Results

1.80 days
FY2022
Results

2.59 days
FY2023
Results

2.63 days
FY2024
Targets

1.00 day
Health indicators for achieving the task
Percentage of full-time employees with long-term absences or leave taken for injury or illness*3
FY2019
Results

0.24%
FY2020
Results

0.39%
FY2021
Results

0.38%
FY2022
Results

1.00%
FY2023
Results

0.97%
FY2024
Targets

-
Health indicators for achieving the task
[Improve on presenteeism]
SPQ (the University of Tokyo one-item version) (average for all employees)*2
FY2019
Results

-
FY2020
Results

-
FY2021
Results

87.1%
FY2022
Results

86.9%
FY2023
Results

87.8%
FY2024
Targets

90.0%
Health indicators for achieving the task
[Improve health literacy]
Percentage of employees who are consistently aware of their own health and make efforts to promote their own health*2
FY2019
Results

-
FY2020
Results

-
FY2021
Results

59.3%
FY2022
Results

55.9%
FY2023
Results

56.9%
FY2024
Targets

60.0%

*1 Data for employees aged 35 and older.

*2 An in-house questionnaire survey was conducted on sense of achievement and personal growth through work, trust from others, sense of contribution to society and the Company, and other perspectives (FY2023, number of subjects: 1,407; response rate: 99.6%).

*3 Employees who experienced long-term absences (more than one month consecutively) or took leave during the period were counted. Includes continuations from the previous fiscal year. Does not include the use of paid/accumulated paid leave, or absences resulting from accidents.

Specific efforts

Logo and tagline

The logo and tagline that symbolize our health management activities are the result of ideas solicited from our employees and their families. We use the logo and tagline to broadly disseminate health management measures so that all employees can work together to improve their health.

“Our Common Goal: Healthy OilliO”

Prevention

It is an integral responsibility of the company to consider the physical and mental well-being of its employees. To ensure that each and every employee is healthy and active, we are making efforts to enhance medical examination items, regular stress checks, and follow-up systems. In cooperation with the health insurance society, we are also committed to disease prevention projects such as cancer screenings, subsidies for physical examinations, and free dental examinations. As a preventative measure against infectious diseases, we cover part of the cost of influenza vaccinations and provide in-house group vaccinations so that employees can be vaccinated during work hours. Additionally, we regularly hold health seminars and checkup events to raise awareness of health preservation.

Key initiatives in FY2023

Online health seminars Five seminars were held on topics including exercise, nutrition, sleep, and relaxation (122 participants)
Video seminars on women’s health Five on-demand seminars for female employees and managers were held to build understanding and support for women-specific health issues throughout the workplace
Life Plus Project to support the health of working women Health information for working women was provided through a special app based on attributes (gender/age), lifestyle, and interest level (101 participants)
Health checkup event A health checkup event was held to offer simple tests for items not covered in regular health examinations, such as the amount and balance of muscle and fat, posture, and skin age checks (174 participants, 91.5% satisfaction rate)

Improving dietary habits

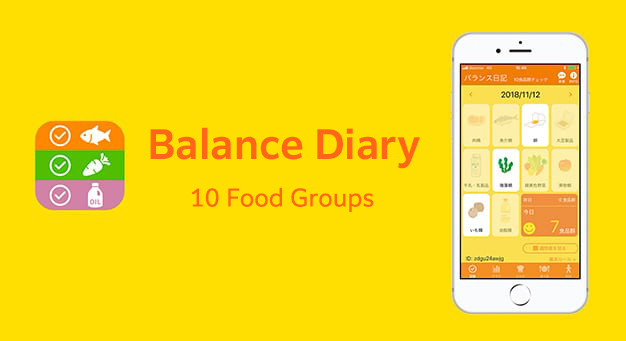
As a company involved in food and the daily diet, it is our mission to contribute to the health of many generations. We collaborated with the Tokyo Metropolitan Geriatric Hospital and Institute of Gerontology to develop a free self-check food app called “Balance Diary: 10 Food Groups,” which is open to the public and is actively used by employees.

Additionally, to support employees’ health in terms of what they regularly eat, employee cafeterias provide the Company’s healthy oils and salad dressings and serve healthy and nutritionally balanced set menus, where the foods used from the 10 food groups are indicated on the menu. These and other efforts have been well received by employees. In 2021, we began offering meals at the employee cafeterias in line with the Smart Meal standards reviewed and certified under the Certification System for Healthy Meal and Food Environment.* We believe that eating an ideally nutritionally balanced diet will lead to increased vegetable intake and improved sodium intake, ultimately preventing lifestyle-related diseases/disorders (one of our greatest health challenges).

Furthermore, the Sakai Plant and the Mizushima Complex introduced Office De Yasai (Vegetables in the Office), a program that lets employees maintain healthy dietary habits and have nutritionally balanced meals at the office. The Nagoya Plant has begun offering individual salads in cups and side dishes made primarily with vegetables as well as miso soup and other soups containing an abundance of vegetables.

* The Certification System for Healthy Meal and Food Environment certifies stores and establishments that continuously provide nutritionally balanced meals (“Smart Meals”) that help promote good health in healthy spaces for food service, home meal replacements, and meals for corporate cafeterias. The certification is provided by the Consortium for Healthy Meal and Food Environment, which comprises 13 academic societies that support the project, including the Japanese Society of Nutrition and Dietetics and the Japan Diabetes Society.

Balance Diary

Example of a cafeteria meal

Smart Meal logo

Promoting smoking cessation

To encourage employees to quit smoking and prevent health hazards caused by passive smoking, we are in the process of eliminating smoking rooms or restricting their use during working hours. We subsidize the cost of outpatient and online smoking cessation treatment programs and nicotine gum-based short-term introductory smoking cessation programs for employees and their family members who are trying to quit smoking. From FY2022 to FY2023, we held the Team Smoking Cessation Marathon, an event in which one smoker and two nonsmoker supporters teamed up to tackle the challenge to quit smoking. Fourteen teams from across the Company participated, 10 of whom successfully completed the challenge. As of September 2024, a total of 42 employees have used the Company’s support system, which began in FY2021.

Promoting exercise and communication

We encourage and support volunteer after-hours activities (“clubs”) to physically and mentally rejuvenate employees and invigorate communication at business locations throughout Japan. Employees from different generations gather together in roughly 20 clubs to engage in activities including baseball, table tennis, badminton, and yoga. We have also introduced a welfare program that allows employees to exercise at fitness clubs at reduced rates and have installed training rooms at some of our business locations to facilitate employee engagement in physical activity.

In 2020, we launched The Nisshin OilliO Group Health Portal Site to raise awareness and encourage behavioral change and development of healthy habits. We have developed a points system where points are awarded for daily walking and other efforts to promote health. The points can be redeemed for products. We also put on walking events using this website, publish step count rankings (individual and departmental), and undertake other measures to make health promotion fun and motivating.

Reference information

Health Portal Site

Participation rate: 52.0% (as of September 2024)
Amount of investment: Roughly 2.29 million yen (FY2023)

Number of people who completed the requirement* for the three-month walking event: 329 (FY2021), 269 (FY2022), 262 (FY2023)

* Walk at least 500,000 steps in three months

Occupational safety and health initiatives

As part of our occupational safety and health management system, we regularly hold meetings of the Safety and Health Committee and the Safety, Health, and Disaster Prevention Committee, which are established at each business location. These meetings are attended by representatives of the Company and the labor union, and discussions are held to ensure the safety of employees and to create a workplace where they can work comfortably and with a sense of security.

Based on the policies and plans formulated by these committees, employees in charge of promoting occupational safety and health take the lead in implementing initiatives including preventive management aimed at predicting hazards and eliminating potential hazards in advance from a risk management perspective, improvement of work environments, and maintenance and promotion of employee health. We not only comply with the Industrial Safety and Health Act and other relevant laws and regulations, but also actively develop measures to ensure the safety of all employees and link them with our health management initiatives.

For data on safety, health, and disaster prevention, see our Sustainability Data Book.

White 500 certification We were certified as a 2024 Health & Productivity Management Outstanding Organization (large enterprise category) under the certification system jointly operated by the Ministry of Economy, Trade and Industry and the Nippon Kenko Kaigi (“Japan Health Council”). Under the system, companies’ level of health management is evaluated, and the top 500 companies in the large enterprise category are recognized as “White 500.” We were first certified as a White 500 company in 2017, and this marks the sixth time we have been certified.